The Ex-Gay Survivor's Survey Demographics
From September 2011 until the end of November, 2012, 417 people filled out the ex-gay survivors survey (averaging one person a day for just over a year).
GENDER, ORIENTATION, AND ETHNICITY SELF-IDENTIFICATION
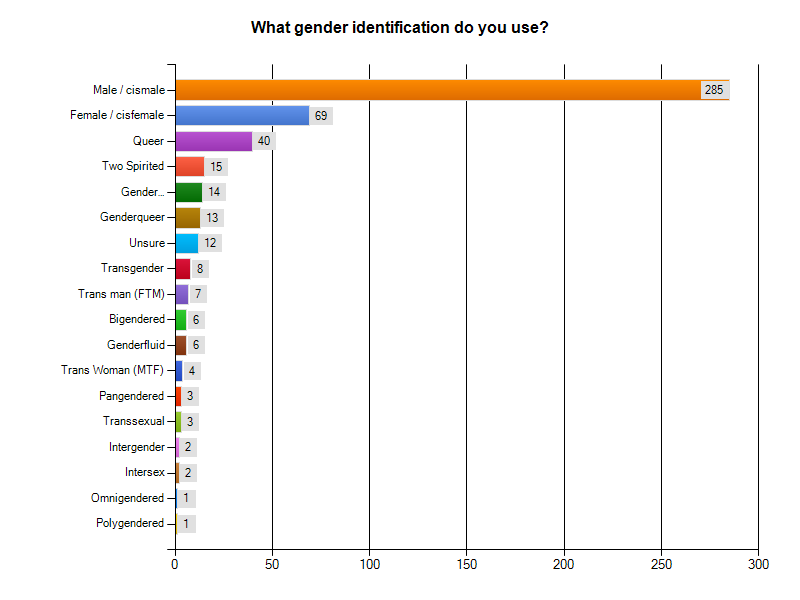
Question 14. What gender identification do you use?
400 participants out of 417 answered this question
Other gender identifications written in the blank box option:
Androphile, Natural born Eunuch, Raised as female, but never was a female, Christosexual, human being, "Homosexually constituted phallic-centric Christian Man," dual gendered (male dominant), still figuring it all out.
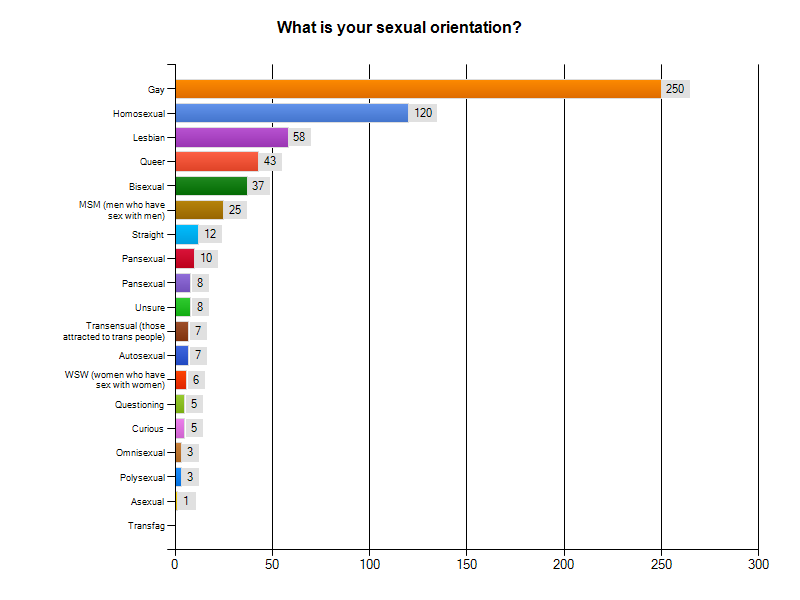
Question 15. What is your sexual orientation?
415 participants out of 417 answered this question.
Other orientation identifications written in the blank box option:
m4m, SGL = Same Gender Loving, Androphilic (attracted to males/masculinity), Autosexual, “Not sure which one to use, so far I have trouble saying anything other than "I'm not straight", but I know I'm most likely a Lesbian because I never crush on guys no matter how hard I try.” Bisexual, leaning gay, 75% gay, 25% bi-curious, “since I see myself as a woman and am with a man, I label myself as straight.” Potentially fluid, None of the above.
Survey Results Introduction | Return To Questions
Question 17. What is your ethnicity?
379 participants out of 417 answered this question. They were only given a blank box to write their responses. 25 people wrote either “mixed race” or put a combination of races like “asian/british” which were placed in the same “mixed race” category.
333 - White / Caucasian
25 - Mixed Races
11 - African / Black
5 - Hispanic
2 - Asian Pacific
2 - Native American
1 - Middle Eastern
We allowed people to be free and diverse in the use of labels in these categories. Still there clearly emerged an overwhelming, and not surprising majority of white gay males. More than 60% labeled themselves gay. More than 71% labeled themselves male. More than 87% identified as white/Caucasian. These numbers place emphasis on the longstanding question of why SOCE's are predominantly filled with this specific population, except for the obvious reason that this is the same population that fills many of the churches where ex-gay ministries reside.
AGE ENTERING AND LENGTH OF TIME INVOLVED IN SOCE’s
Question 2. In general, how long a period of time was your experience?
412 out of 417 answered this question.
The mean average length of time spent involved with SOCE’s for these participants was 6 years and 10 months, with a range of fifty years (19 people only attended a month or less while one person maxed the scale out at 50 years). The rounder numbers were, not surprisingly, more popular:
32 people at 6 months
31 people at 1 year
50 people at 2 years
50 people at 3 years
31 people at 5 years
33 people at 10 years
19 people at 15 years
17 people at 20 years
2 people at 30 years
2 people at 35 years
2 people at 40 years
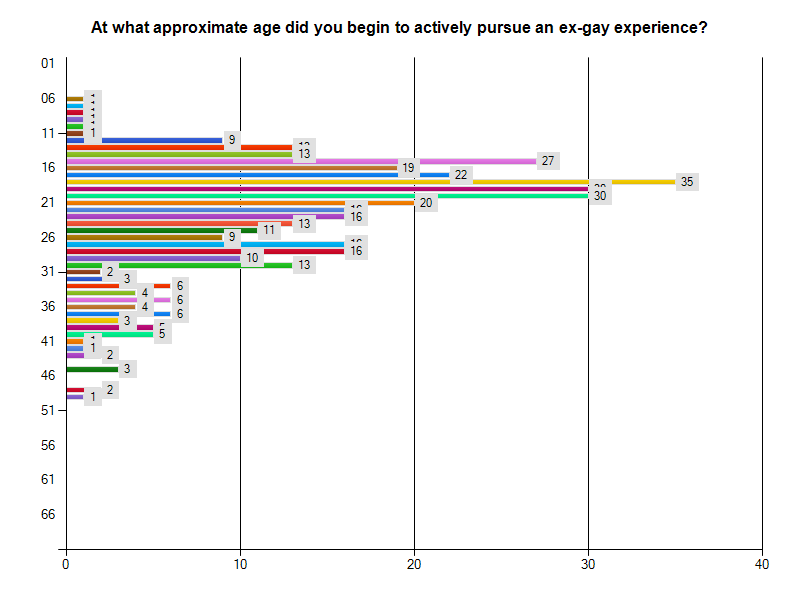
Question 3. At what approximate age did you begin to actively pursue an ex-gay experience?
398 out of 417 answered this question.
The mean average age of these participants beginning to actively pursue SOCE’s was 22.4 years old, with a range of 43 years.
Survey Results Introduction | Return To Questions
FINANCIAL EXPENSE
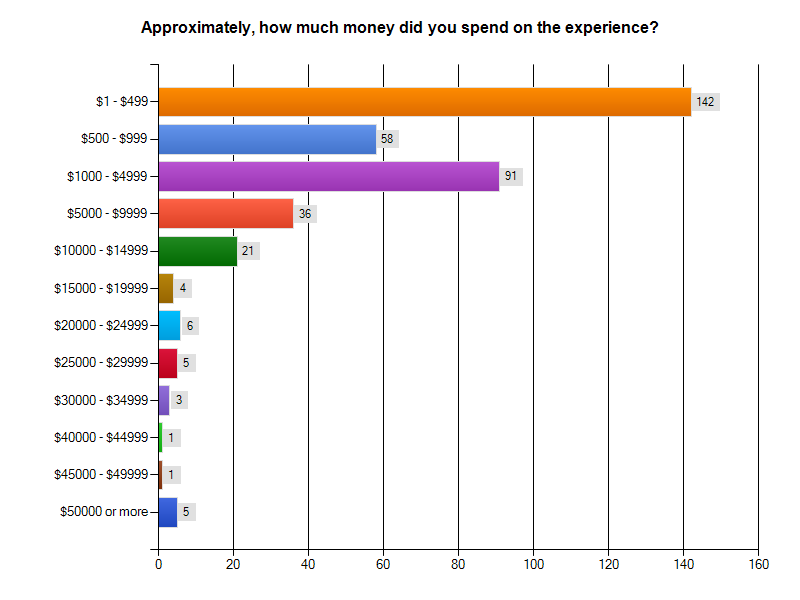
Question 5. Approximately how much money did you spend on the experience?
373 participants out 417 answered this question.
It would appear that not many of the survey participants spent much money on their SOCE (almost half only spent under $500). However, when the numbers are added up, it suggests that these participants spent in total between, $1,240,091 and $2,088,627.
Survey Results Introduction | Return To Questions
RELIGIOUS AFFILIATION
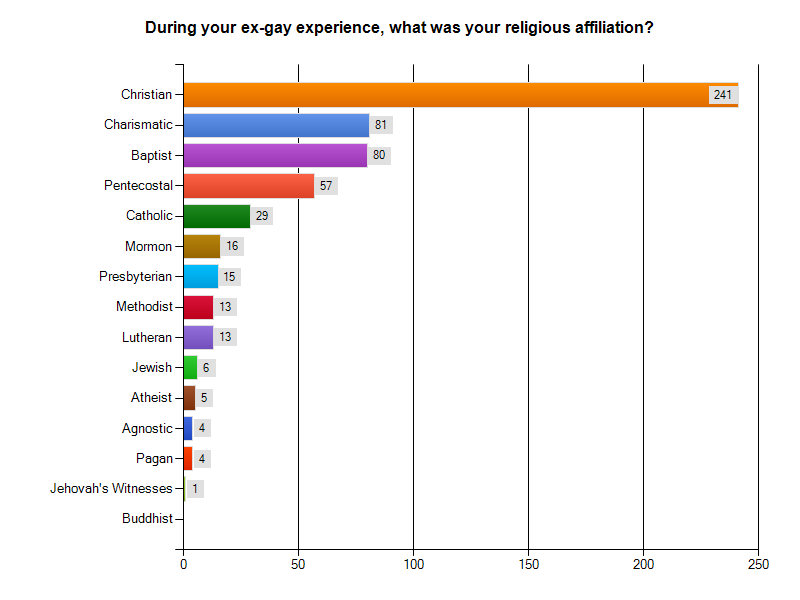
Question 4. During your ex-gay experience, what was your religious affiliation?
392 participants out 417 answered this question.
Participants were given the option to write in their own specific affiliation which included: Nondenominational (5), Church of God, Nazarene (3), Seventh Day Adventist (2), Episcopal (4), Mennonite (3), Christian Reformed Church, Christian Scientist, Unitarian, Interdenominational Charismatic (2), Plymouth Brethren (2), Christian & Missionary Alliance (2), Assembly of God (2), Foursquare (3), Church of Christ (4), Eastern Orthodox, Evangelical (3), Reformed Church in America, Vineyard (2), The Salvation Army, Muslim, Scientology, Word of Faith, Anglican, Baha'i Faith.
Survey Results Introduction | Return To Questions
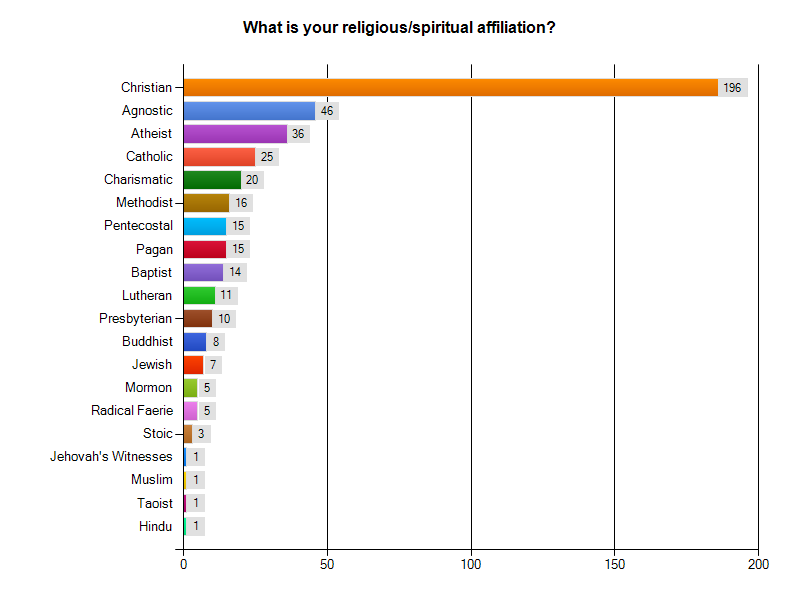
Question 16. What is your religious/spiritual affiliation?
335 participants out of 417 answered this question.
Participants were given the option to write in their own specific affiliation which included: Anglican (3), Pantheism (2), Science of Mind, spiritual (12), none (23), Religious Scientist, Episcopalian (16), Non-denominational (6), Christian Reformed, believer/follower in Jesus Christ (32), Pentecostal, Unitarian Universalist (10), Humanist (3), Interdenominational Charismatic Inclusive Affirming, Monotheist, Unsure (5), United Church of Christ (3), Christian & Missionary Alliance, Wiccan (2), Grace Communion International (formerly Worldwide Church of God), Emergent, New Thought (2), reformed judaism (2), Gnostic, Quaker (3), The Salvation Army, New Age, Deist, Discordian, Mennonite, Orthodox Christian, homospiritual.
During their SOCE experiences nearly all who answered question 4 (392) were affiliated with a Christian-related denomination. Then, question 16 asked what was their present religious affiliation, which only 335 people answered it (57 fewer answers than question 4). All of the denominations dropped in numbers from question 4, some by half, while categories like atheists and agnostics grew, some as much as tenfold. Further, in the written option of question 16 there were several labels such as “spiritual,” “none,” “Humanist,” “unsure,” while these labels did not appear at all in the written portion of question 4. The difference between these two results seems to indicate that SOCEs may have a negative/destructive effect on religious affiliations.
Survey Results Introduction | Return To Questions
GEOGRAPHIC LOCATION OF PARTICIPANTS:
Question 18. What Country, State/Province do you live in?
226 participants out of 417 answered this question.
Of those who answered, 83% were spread out across 42 of the 50 United States. The most concentrated numbers of participants were from:
27 from California
20 from Texas
12 from New York
11 from Washington State
10 from Florida
8 from Tennessee
7 each from Missouri and North Carolina
6 each from Illinois, Indiana and Oregon
5 from Georgia
17% of those who answered this question were from outside the US.
9 from Canada
6 from the UK
4 each from the Netherlands and South Africa
3 from Australia
1 each from Brazil, Egypt, Germany, Mexico, Peru, Trinidad, Taiwan, Turkey, and Uganda.
< Previous | Survey Results Introduction | Questions | Demographics | Conclusion | Next >
SOCE Survey Results are © Copyright 2013. Jallen Rix, Ed.D., ACS and BeyondExGay.com.
Please ask permission before using this material.

